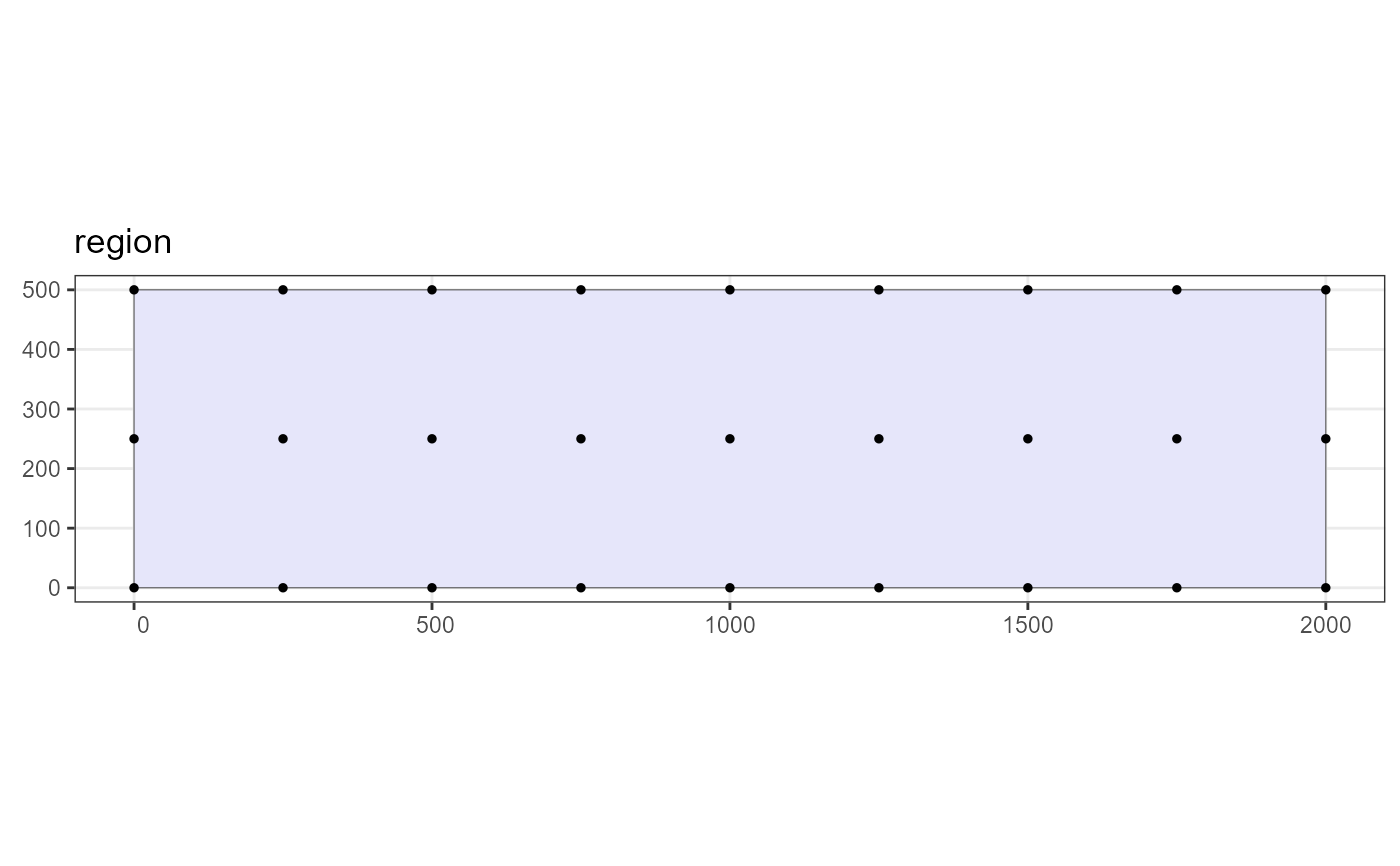
This creates an instance of the Coverage.Grid class.
Usage
make.coverage(
  region = make.region(),
  spacing = numeric(0),
  n.grid.points = 1000
)
Arguments
- region
the region name
- spacing
spacing to be used to create the coverage grid. If spacing is specified then any value supplied for n.grid.points will be ignored.
- n.grid.points
the desired number of grid points (note that the exact number generated may differ slightly depending on the shape of the study region).
Examples
# Fast running example, please note to more accurately assess coverage
# the spacing should be reduced. Spacings of between 20 and 50 will allow
# a better assessment of coverage to be achieved.
region <- make.region()
cover <- make.coverage(region, spacing = 250)
plot(region, cover)
