Creates a description of a survey design. Designs may use different types of either point or line transect designs across strata but cannot mix point and line transect design types within a single design object.
Usage
make.design(
  region = make.region(),
  transect.type = "line",
  design = "systematic",
  samplers = numeric(0),
  line.length = numeric(0),
  seg.length = numeric(0),
  effort.allocation = numeric(0),
  design.angle = 0,
  spacing = numeric(0),
  edge.protocol = "minus",
  seg.threshold = numeric(0),
  bounding.shape = "rectangle",
  truncation = 50,
  coverage.grid = NULL
)
Arguments
- region
an object of class Region defining the survey region.
- transect.type
character variable specifying either "line" or "point"
- design
a character variable describing the type of design. Either "random", "systematic", "eszigzag" (equal-spaced zigzag), "eszigzagcom" (equal spaced zigzag with complementary lines) or "segmentedgrid". See details for more information.
- samplers
the number of samplers you wish the design to generate (note that the number actually generated may differ slightly due to the shape of the study region for some designs). This may be one value or a value for each stratum.
- line.length
the total line length you desire or a vector of line lengths the same length as the number of strata.
- seg.length
the length of the line transect segments for a segmented grid design.
- effort.allocation
Used for multi-strata regions where only a total effort value is provided. This numeric argument should have one value per stratum indicating the proportion of the total effort to allocate to that stratum. If length is 0 (the default) and only a total line length or total number of samplers is supplied, effort is allocated based on stratum area.
- design.angle
numeric value detailing the angle of the design. Can provide multiple values relating to strata. The use of the angle varies with design, it can be either the angle of the grid of points, the angle of lines or the design axis for the zigzag design. See details. In addition, a value of -1 will cause a random design angle to be generated.
- spacing
used by systematic designs, numeric value(s) to define spacing between transects. Can be a vector of values with one value per stratum.
- edge.protocol
character value indicating whether a "plus" sampling or "minus" sampling protocol is used. See details.
- seg.threshold
this is a percentage threshold value applicable to segmented grid designs controlling which partial segments are discarded around the survey region boundary. By default, the value of 50, means that only segments that are more than half inside the survey region will be retained. To retain all segments, no matter how small they are when clipped to the survey region boundary set this value to 0.
- bounding.shape
only applicable to zigzag designs. A character value saying whether the zigzag transects should be generated using a minimum bounding "rectangle" or "convex.hull". The default is a minimum bounding rectangle.
- truncation
A single numeric value describing the longest distance at which an object may be observed. Truncation distance is constant across strata.
- coverage.grid
An object of class Coverage.Grid for use when running the coverage simulation.
Value
object of a class which inherits from class Survey.Design either Line.Transect.Design or Point.Transect.Design
Details
Plus versus Minus Sampling If you choose for your design to use a minus sampling strategy then transects will only be generated within the survey region and will give lower coverage around the edge of the survey region. Plus sampling generates transects within an area greater than the study region. To do this dssd first puts a buffer around the study region before generating the transects within the buffered region. The width of the buffer is the truncation distance supplies by the user. Plus sampling helps to ensure more even coverage around the edge of the study area. See Buckland et. al, 2001 "Introduction to Distance Sampling" for information on when to use plus versus minus sampling.
Point Transect Designs For point transect designs the user may either specify "random" or "systematic" for the design argument. If the user specifies "random", they should also provide a value for effort detailing the number of point transects they wish their survey to have. For stratified designs they may specify a vector of numbers detailing the number of transects per strata or alternatively use the effort.allocation argument to allocate a total effort amount proportionally. If effort.allocation is left blank then effort will be allocated according to strata area. If the user specified"systematic" they may either provide their desired number of samplers or a value for spacing which defines the gap between each of the points (again a vector of spacing values can be provided for each strata). Optionally the user may select a design.angle. For both random and systematic point transect designs the user may select either a minus or plus sampling edge protocol.
Line Transect Designs: For line transect designs the user may either specify "random" (randomly placed full width lines), "systematic" (systematically placed full width lines), "eszigzag" (equally spaced zigzag lines), "eszigzagcom" (two sets of complementary equally spaced zigzag lines) or "segmentedgrid" (a grid of short line transect segments). Note that users may also select a "segmentedtrack" design but dssd does not generate transects from this design. This addition was made so that simulations can be run from Distance for Windows using this design. In this case, the transect shapefiles will be generated by Distance for Windows for use in the simulation. dssd provides this design as an option to allow the design specifications to be stored within the simulation.
If the user specifies a "random" design, they should provide the either the number of samplers they wish the design to generate or the line length they wish to achieve, either by strata or as a total. If the user specifies "systematic" they should specify either the number of samplers, the desired line length or the spacing between lines. The design angle for these parallel line designs refers to the angle of the lines where 0 is a vertical line and moving round in a clockwise direction. If the user specifies a zigzag design they should specify the systematic spacing value, number of samplers or line length to be used and should choose between generating the design in a minimum bounding rectangle or a convex hull. The default is minimum bounding rectangle which gives more even coverage but the convex hull is generally more efficient. A segmented grid design may be generated using the either the number of samplers or total line length, combined with a value for segment length. Alternatively the user may specify a values for spacing and segment length. The segmented grid design also uses the segment threshold argument. All the designs may be generated using plus or minus sampling protocols. Similar to the point transect designs different values may be specified for each strata for all of the above options. The design angle for the zigzag designs refers to the angle of a line which would run through the middle of each zigzag transect if the zigzags were to be generated within a rectangle. The design angle for zigzags should usually run along the longest dimension of the study region. A segmented trackline design requires the same specified values as the segmented grid design.
NOTE: If multiple global design effort arguments are supplied (i.e. spacing, samplers, line.length) then only the first of spacing then line.length then number of samplers will be used. The other values provided will be discarded. Different design effort arguments may supplied for different strata. This is achieved by supplying vectors of numeric values for each of the desired effort measures, there should be 1 value for each stratum. A value indicates the effort for that stratum and NA's should be used to ensure that only one measure of effort is defined for each stratum.
Effort Allocation: For multi-strata designs users are able to define a single global effort value, for example number of samplers or line length, and allocate proportions of it to each stratum using the effort.allocation argument. If a global effort value is supplied and effort.allocation is not defined then effort is assigned based on stratum area. This should lead to a design which is at least approximately equal effort across strata. In the case where all strata use the same systematic design then in the absence of effort.allocation the spacing will be calculated globally and exactly equal effort will be achieved. In the case where different designs are chosen for different strata or a non-systematic design is selected then effort and spacing values will be calculated at the stratum level and this can lead to some variations in coverage between strata.
See the Getting Started Vignette and the Multiple Strata in dssd Vignette for example designs.
Examples
#Point transect example
shapefile.name <- system.file("extdata", "TrackExample.shp", package = "dssd")
region <- make.region(region.name = "study area",
shape = shapefile.name)
# \donttest{
# Generate coverage grid (spacing quite sparse for speed)
cover <- make.coverage(region,
n.grid.points = 250)
# Define design
design <- make.design(region = region,
transect.type = "point",
design = "random",
samplers = 25,
design.angle = 45,
edge.protocol = "minus",
truncation = 3,
coverage.grid = cover)
# Generate a single survey instance
survey <- generate.transects(design)
plot(region, survey, covered.area = TRUE)
 # Note, the number of reps here has been set to 5 to avoid lengthy run-times,
# however, the reps should be at least 100 for an idea of design statistics
# (i.e. trackline lengths) and 500 + to give a good odea of coverage.
design <- run.coverage(design, reps = 5)
#>
20% complete
#>
40% complete
#>
60% complete
#>
80% complete
#>
100% complete
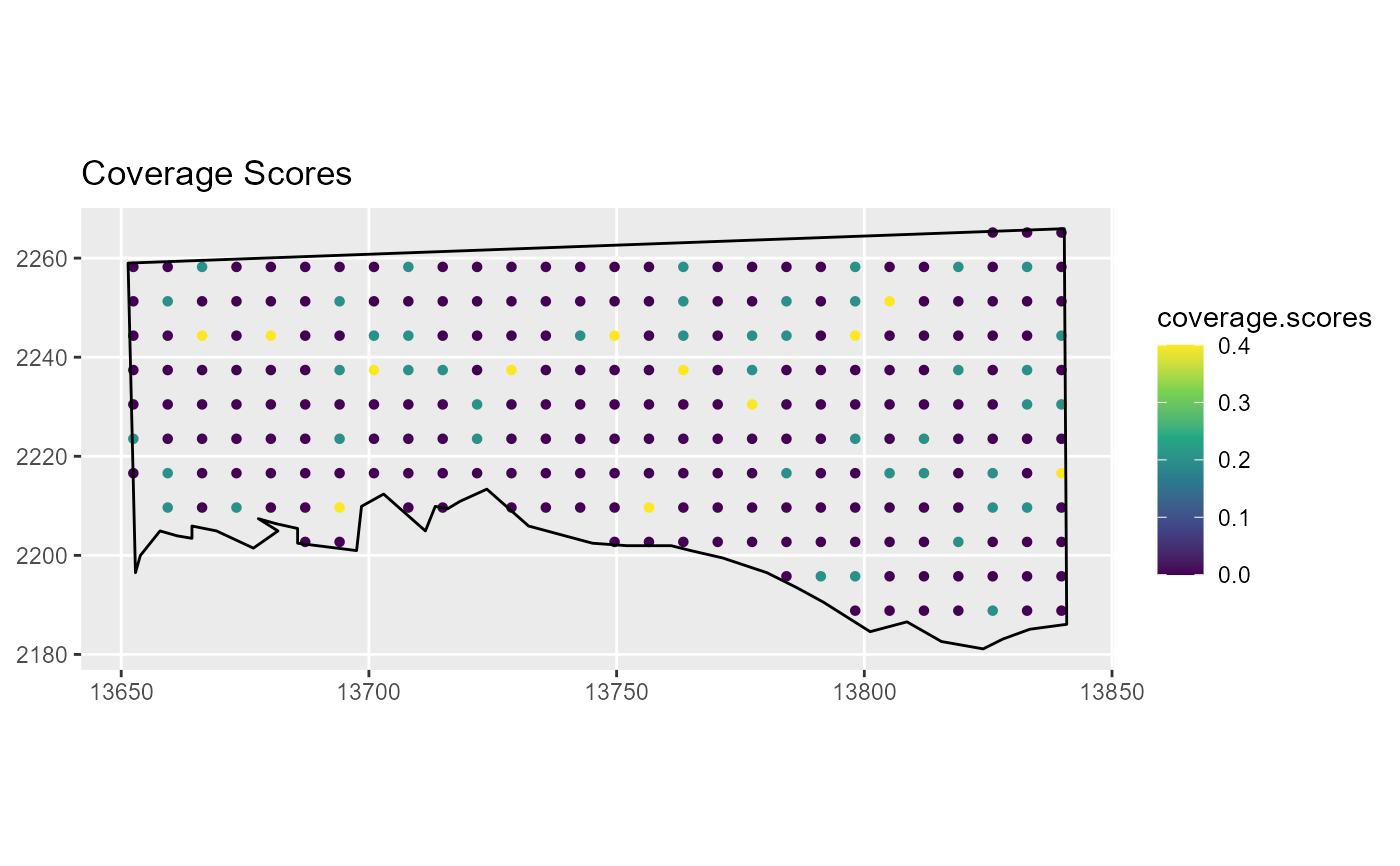
# Plot the coverage
plot(design)
 # Display the design statistics
design
#>
#> Strata study area:
#> ___________________
#> Design: randomly located transects
#> Number of samplers: 25 (shared across strata)
#> Design angle: 45
#> Edge protocol: minus
#>
#> Strata areas: 12037
#> Coverage Simulation repetitions: 5
#>
#> Number of samplers:
#>
#> study area Total
#> Minimum 25 25
#> Mean 25 25
#> Median 25 25
#> Maximum 25 25
#> sd 0 0
#>
#> Covered area:
#>
#> study area Total
#> Minimum 667.76 667.76
#> Mean 684.59 684.59
#> Median 684.38 684.38
#> Maximum 702.79 702.79
#> sd 13.57 13.57
#>
#> % of region covered:
#>
#> study area Total
#> Minimum 5.55 5.55
#> Mean 5.69 5.69
#> Median 5.69 5.69
#> Maximum 5.84 5.84
#> sd 0.11 0.11
#>
#> Coverage Score Summary:
#>
#> study area Total
#> Minimum 0.00000000 0.00000000
#> Mean 0.05390625 0.05390625
#> Median 0.00000000 0.00000000
#> Maximum 0.40000000 0.40000000
#> sd 0.10657031 0.10657031
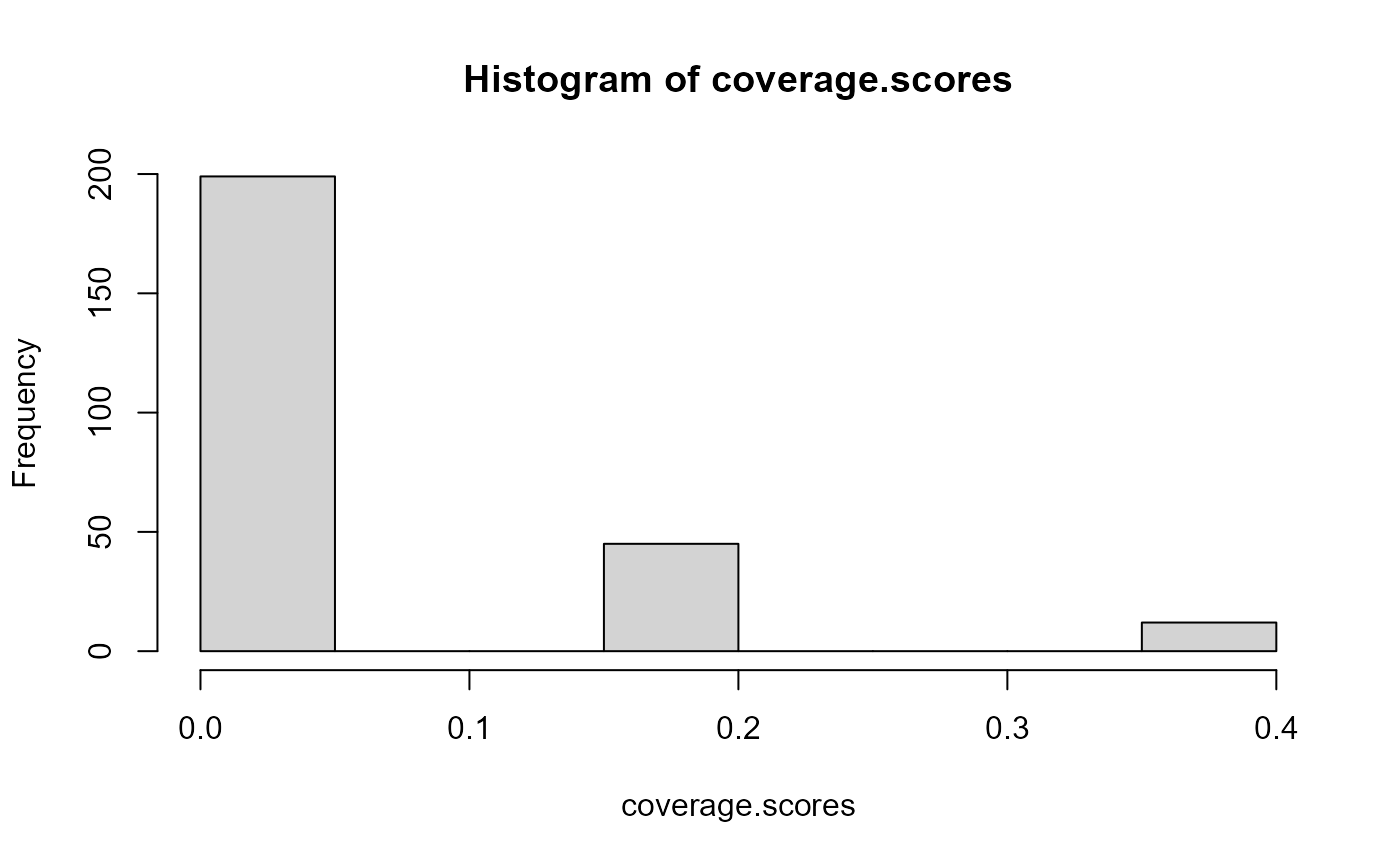
#Extract coverage scores
coverage.scores <- get.coverage(design)
hist(coverage.scores)
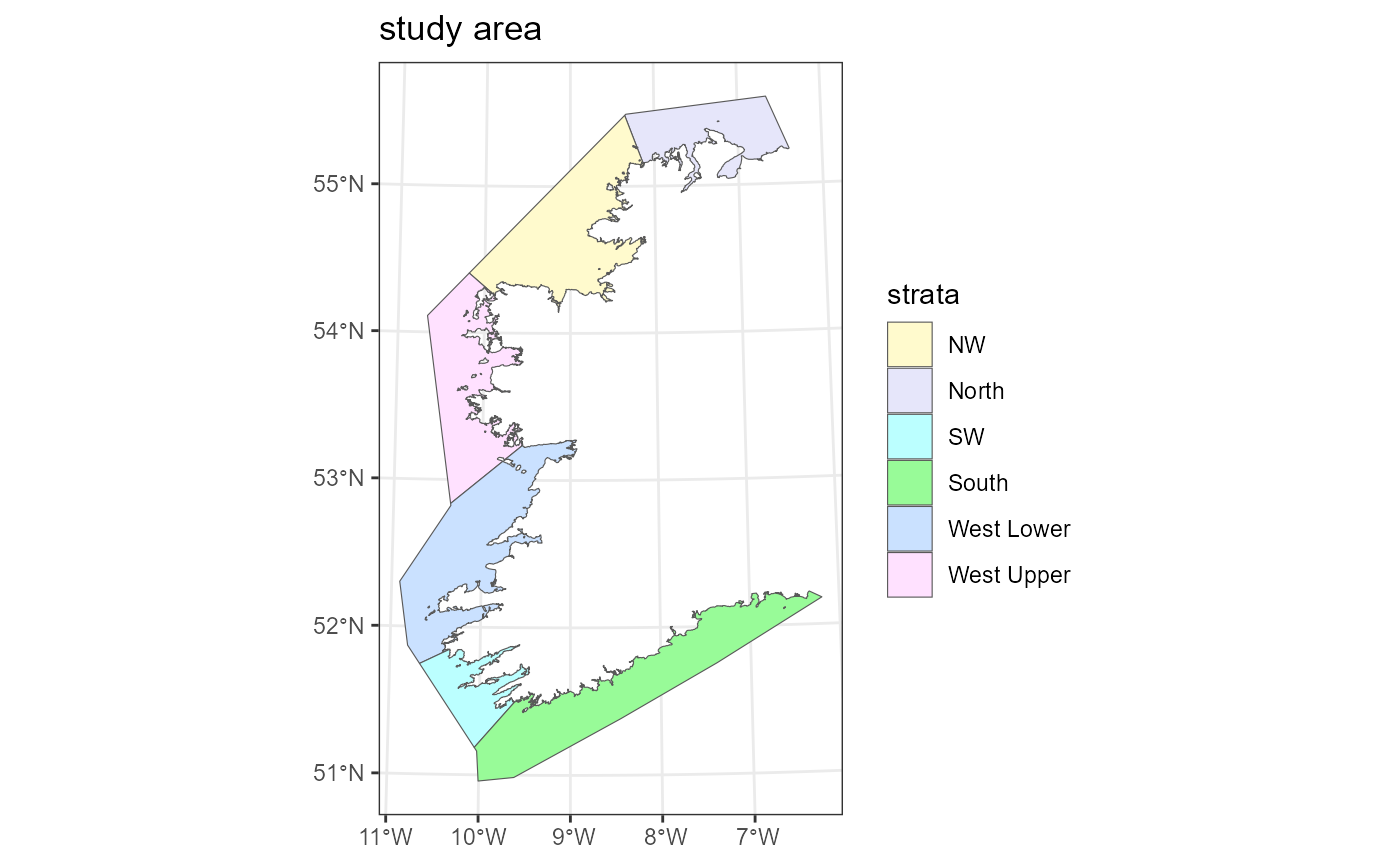
 #Multi-strata line transect example
shapefile.name <- system.file("extdata", "AreaRProjStrata.shp", package = "dssd")
region <- make.region(region.name = "study area",
strata.name = c("North", "NW", "West Upper",
"West Lower", "SW", "South"),
shape = shapefile.name)
plot(region)
 # Make a coverage grid
cover <- make.coverage(region,
n.grid.points = 500)
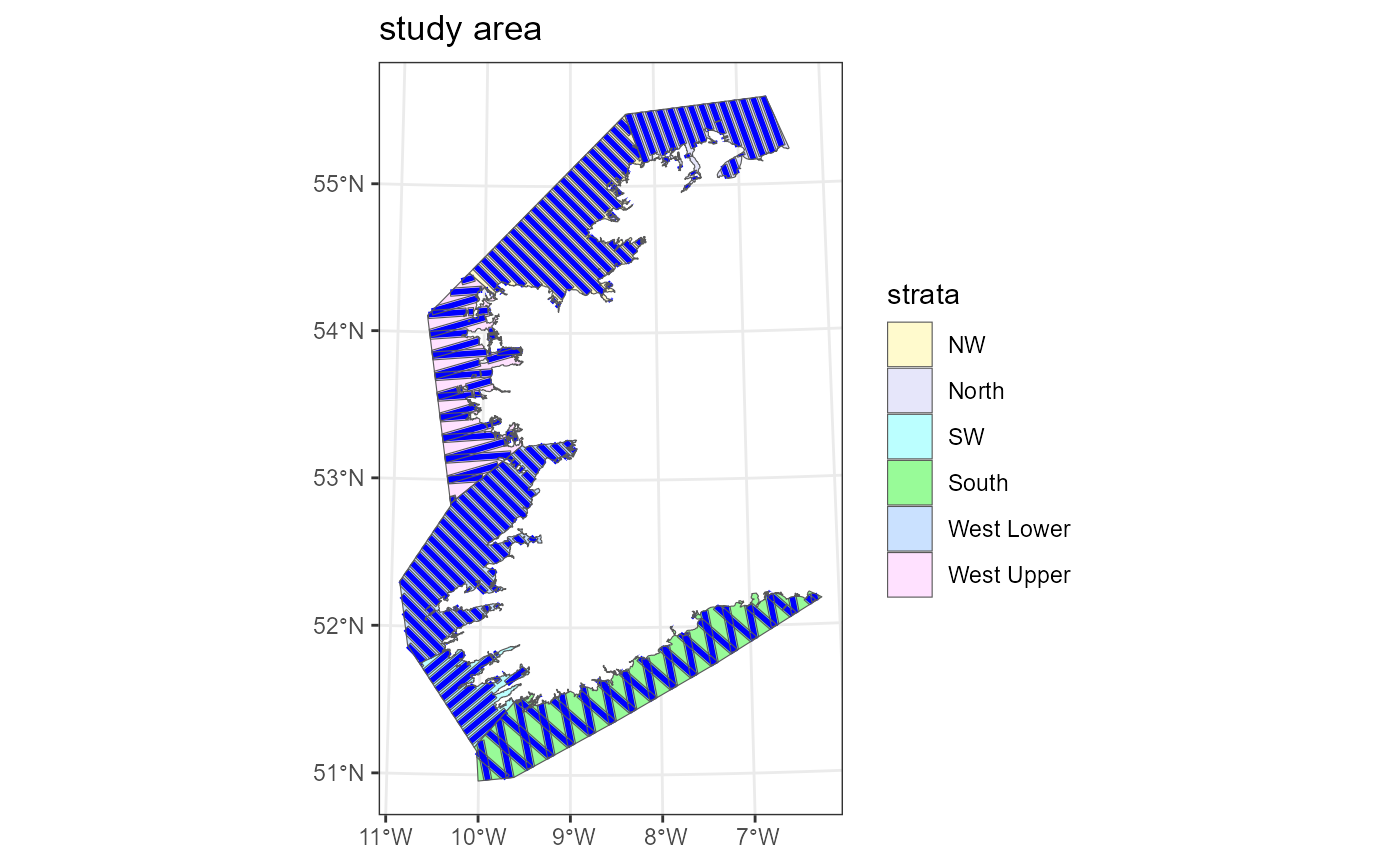
# Define the design
design <- make.design(region = region,
transect.type = "line",
design = c("systematic", "systematic",
"eszigzag", "systematic",
"systematic", "eszigzagcom"),
line.length = 5000*1000, #5000km x 1000m (projection in m)
design.angle = c(160, 135, 170, 135, 50, 60),
edge.protocol = "minus",
truncation = 3000,
coverage.grid = cover)
# Create a single set of transects to check
survey <- generate.transects(design)
plot(region, survey, covered.area = TRUE)
 # Note, the number of reps here has been set to 5 to avoid lengthy run-times,
# however, the reps should be at least 100 for an idea of design statistics
# (i.e. trackline lengths) and 500 + to give a good odea of coverage.
design <- run.coverage(design, reps = 5)
#>
20% complete
#>
40% complete
#>
60% complete
#>
80% complete
#>
100% complete
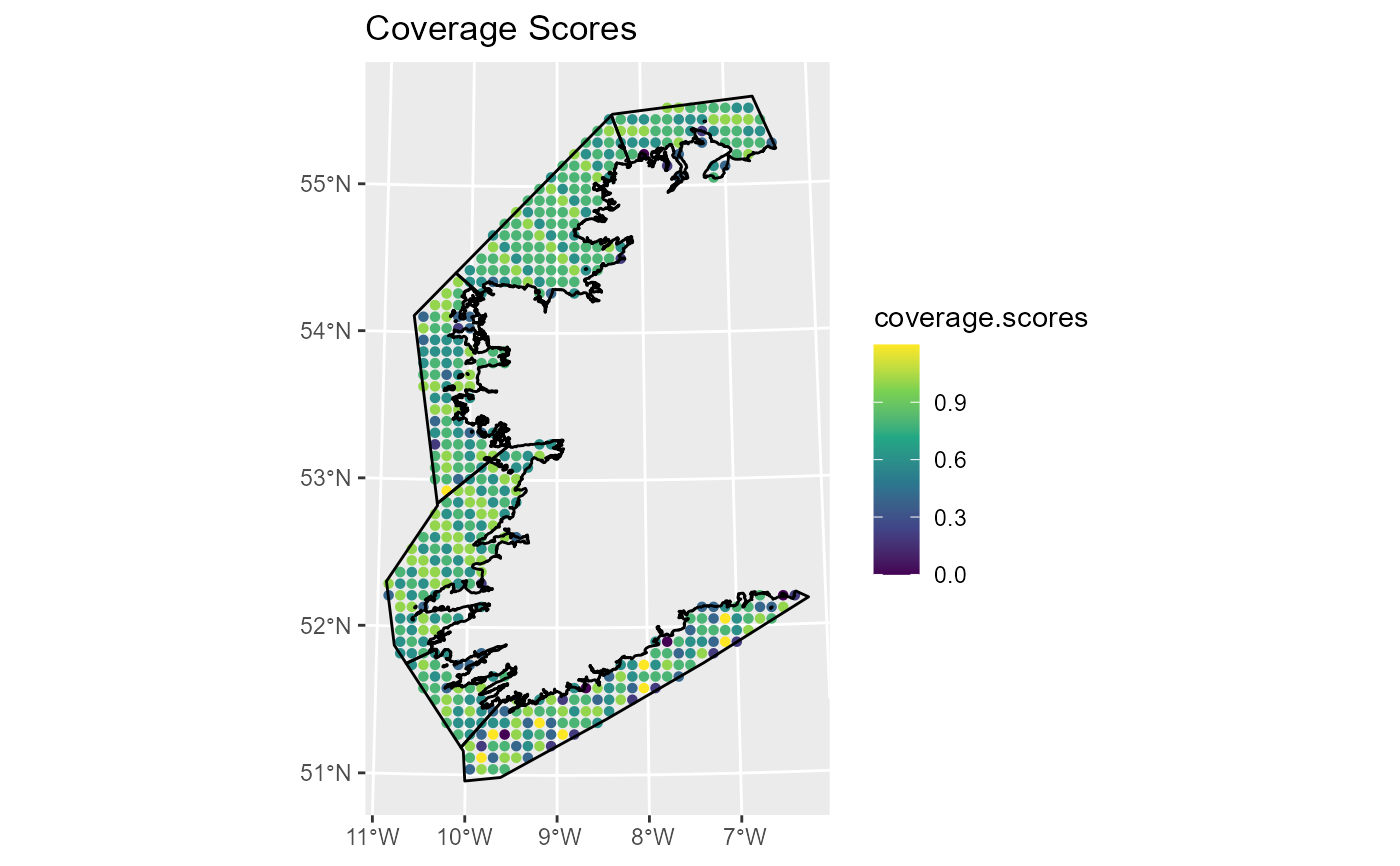
# Plot the coverage
plot(design)
 # Display the design statistics
design
#>
#> Strata North:
#> ______________
#> Design: systematically spaced transects
#> Spacing: NA
#> Number of samplers: NA
#> Line length: 5e+06 (shared across strata)
#> Design angle: 160
#> Edge protocol: minus
#>
#> Strata NW:
#> ___________
#> Design: systematically spaced transects
#> Spacing: NA
#> Number of samplers: NA
#> Line length: 5e+06 (shared across strata)
#> Design angle: 135
#> Edge protocol: minus
#>
#> Strata West Upper:
#> ___________________
#> Design: equal spaced zigzag
#> Spacing: NA
#> Number of samplers: NA
#> Line length: 5e+06 (shared across strata)
#> Design angle: 170
#> Edge protocol: minus
#>
#> Strata West Lower:
#> ___________________
#> Design: systematically spaced transects
#> Spacing: NA
#> Number of samplers: NA
#> Line length: 5e+06 (shared across strata)
#> Design angle: 135
#> Edge protocol: minus
#>
#> Strata SW:
#> ___________
#> Design: systematically spaced transects
#> Spacing: NA
#> Number of samplers: NA
#> Line length: 5e+06 (shared across strata)
#> Design angle: 50
#> Edge protocol: minus
#>
#> Strata South:
#> ______________
#> Design: complementaty equal spaced zigzags
#> Spacing: NA
#> Number of samplers: NA
#> Line length: 5e+06 (shared across strata)
#> Design angle: 60
#> Edge protocol: minus
#>
#> Strata areas:
#> 4176461143, 8180996497, 6316380968, 8188111047, 2654685511, 9291229356
#> Region and effort units: m
#> Coverage Simulation repetitions: 5
#>
#> Number of samplers:
#>
#> North NW West Upper West Lower SW South Total
#> Minimum 14 21.0 21.0 26.0 10 32.0 126.0
#> Mean 14 21.6 21.2 26.6 10 33.0 126.4
#> Median 14 22.0 21.0 27.0 10 33.0 126.0
#> Maximum 14 22.0 22.0 27.0 10 34.0 127.0
#> sd 0 0.5 0.4 0.5 0 0.7 0.5
#>
#> Covered area:
#>
#> North NW West Upper West Lower SW South
#> Minimum 2988249491 6084430769 4450331963 6029503796 1797940847 6285161935
#> Mean 3022315232 6121980702 4497572103 6052222179 1839055802 6375231609
#> Median 3025693717 6135293401 4471216906 6030967541 1828217839 6381261519
#> Maximum 3055170362 6139856372 4579774745 6121954309 1883478705 6458582336
#> sd 24398171 23576303 52888664 39764063 38614055 68690900
#> Total
#> Minimum 27780426456
#> Mean 27908377627
#> Median 27894556275
#> Maximum 28046994710
#> sd 130454160
#>
#> % of region covered:
#>
#> North NW West Upper West Lower SW South Total
#> Minimum 71.55 74.37 70.46 73.64 67.73 67.65 71.58
#> Mean 72.37 74.83 71.20 73.91 69.28 68.62 71.91
#> Median 72.45 74.99 70.79 73.66 68.87 68.68 71.88
#> Maximum 73.15 75.05 72.51 74.77 70.95 69.51 72.27
#> sd 0.58 0.29 0.84 0.49 1.45 0.74 0.34
#>
#> Line length:
#>
#> North NW West Upper West Lower SW South
#> Minimum 531609.5 1050941.25 793186.98 1042757.26 323819.0 1078399.38
#> Mean 537385.1 1054634.65 800583.08 1053356.92 342032.5 1096995.36
#> Median 538249.2 1055611.62 797866.41 1052249.52 347430.1 1097054.72
#> Maximum 540669.1 1059098.69 816492.72 1066183.25 354399.9 1110227.57
#> sd 3456.1 3276.52 9340.64 8357.94 13527.6 12957.62
#> Total
#> Minimum 4855108.18
#> Mean 4884987.56
#> Median 4883907.24
#> Maximum 4920365.76
#> sd 24887.93
#>
#> Trackline length:
#>
#> North NW West Upper West Lower SW South
#> Minimum 778343.58 1382350.70 982026.33 1415867.22 472168.02 1318721.07
#> Mean 792583.79 1389594.73 998933.38 1446905.03 525065.95 1346036.58
#> Median 793983.57 1389486.38 998395.41 1452577.04 554892.10 1351142.50
#> Maximum 810093.81 1397647.08 1008384.50 1462220.74 559257.07 1368684.22
#> sd 12456.56 6914.25 10613.44 17972.18 44594.95 18352.19
#> Total
#> Minimum 6442715.71
#> Mean 6499119.45
#> Median 6485821.63
#> Maximum 6547325.23
#> sd 43485.69
#>
#> Cyclic trackline length:
#>
#> North NW West Upper West Lower SW South
#> Minimum 880639.60 1538411.8 1139897.56 1614419.54 545899.45 1339090.29
#> Mean 894293.99 1550558.8 1158966.37 1648749.66 596319.90 1365065.63
#> Median 895134.89 1547497.5 1165490.91 1653087.69 624978.63 1365624.17
#> Maximum 912354.14 1562706.1 1166949.31 1667287.41 629151.76 1390014.59
#> sd 12379.18 10219.1 11529.26 20202.38 42782.13 18982.68
#> Total
#> Minimum 7153188.7
#> Mean 7213954.3
#> Median 7215589.2
#> Maximum 7253131.0
#> sd 41157.4
#>
#> Coverage Score Summary:
#>
#> North NW West Upper West Lower SW South Total
#> Minimum 0.0000000 0.2000000 0.2000000 0.0000000 0.2000000 0.2000000 0.0000000
#> Mean 0.7200000 0.7518519 0.7164557 0.7847619 0.7000000 0.6840336 0.7300000
#> Median 0.8000000 0.8000000 0.8000000 0.8000000 0.7000000 0.6000000 0.8000000
#> Maximum 1.0000000 1.0000000 1.2000000 1.0000000 1.0000000 1.2000000 1.2000000
#> sd 0.2946435 0.1614661 0.2388167 0.2397037 0.2160247 0.2277313 0.2292709
# Extract coverage scores for the first strata
coverage.scores <- get.coverage(design, strata.id = 1)
summary(coverage.scores)
#> Min. 1st Qu. Median Mean 3rd Qu. Max.
#> 0.00 0.60 0.80 0.72 1.00 1.00
# }
# Fast running example for CRAN testing purposes
# This spacing is too sparse to assess coverage in a real example and
# the number of repetitions is too low to assess design statistics
cover <- make.coverage(region,
n.grid.points = 50)
design <- make.design(region = region,
transect.type = "point",
design = "random",
samplers = 25,
design.angle = 45,
edge.protocol = "minus",
truncation = 3,
coverage.grid = cover)
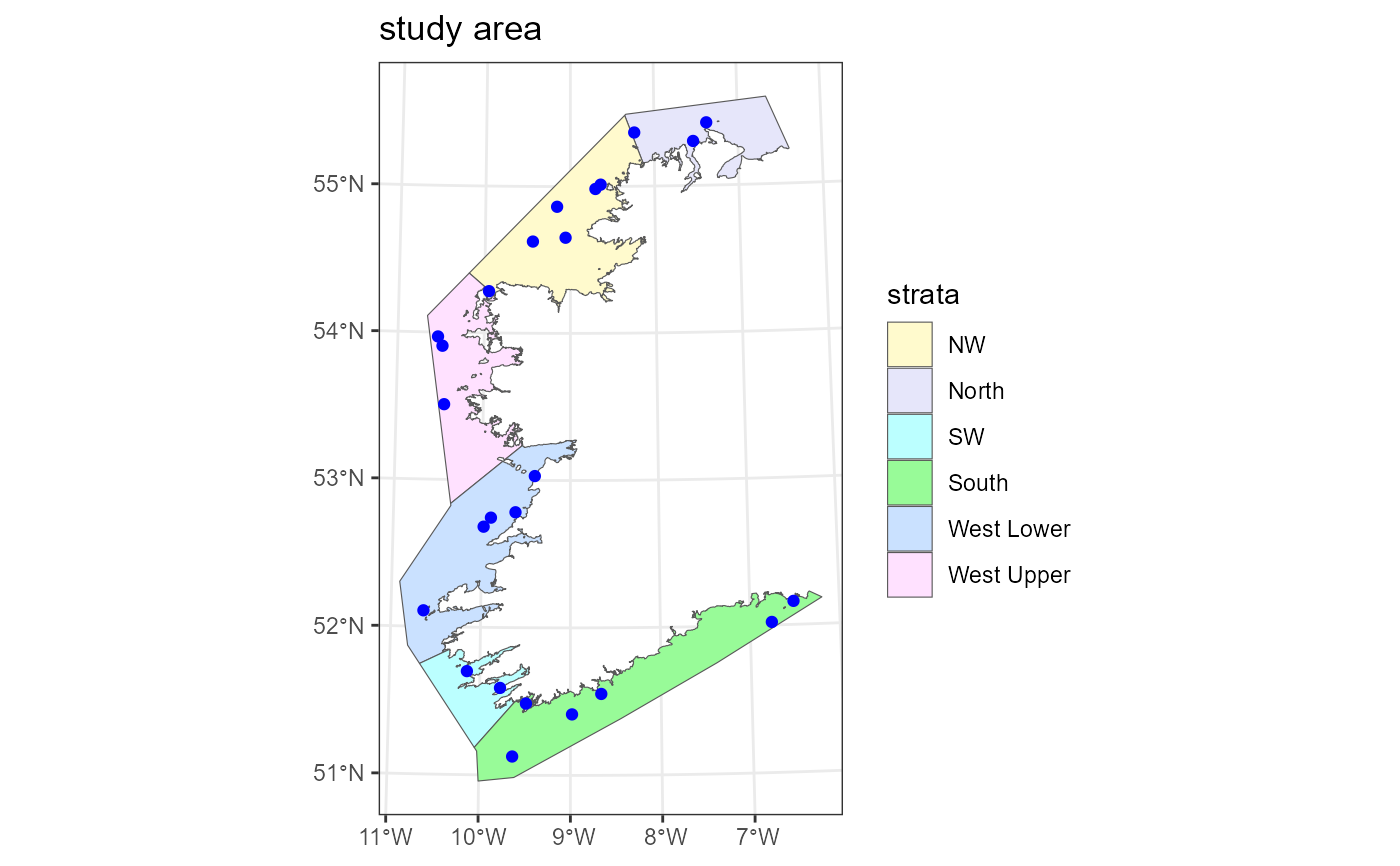
survey <- generate.transects(design)
plot(region, survey, covered.area = TRUE)
 design <- run.coverage(design, reps = 3)
#>
33.3% complete
#>
66.7% complete
#>
100% complete
plot(design)
 design
#>
#> Strata North:
#> ______________
#> Design: randomly located transects
#> Number of samplers: 25 (shared across strata)
#> Design angle: 45
#> Edge protocol: minus
#>
#> Strata NW:
#> ___________
#> Design: randomly located transects
#> Number of samplers: 25 (shared across strata)
#> Design angle: 45
#> Edge protocol: minus
#>
#> Strata West Upper:
#> ___________________
#> Design: randomly located transects
#> Number of samplers: 25 (shared across strata)
#> Design angle: 45
#> Edge protocol: minus
#>
#> Strata West Lower:
#> ___________________
#> Design: randomly located transects
#> Number of samplers: 25 (shared across strata)
#> Design angle: 45
#> Edge protocol: minus
#>
#> Strata SW:
#> ___________
#> Design: randomly located transects
#> Number of samplers: 25 (shared across strata)
#> Design angle: 45
#> Edge protocol: minus
#>
#> Strata South:
#> ______________
#> Design: randomly located transects
#> Number of samplers: 25 (shared across strata)
#> Design angle: 45
#> Edge protocol: minus
#>
#> Strata areas:
#> 4176461143, 8180996497, 6316380968, 8188111047, 2654685511, 9291229356
#> Region units: m
#> Coverage Simulation repetitions: 3
#>
#> Number of samplers:
#>
#> North NW West Upper West Lower SW South Total
#> Minimum 3 5 4 5 2 6 25
#> Mean 3 5 4 5 2 6 25
#> Median 3 5 4 5 2 6 25
#> Maximum 3 5 4 5 2 6 25
#> sd 0 0 0 0 0 0 0
#>
#> Covered area:
#>
#> North NW West Upper West Lower SW South Total
#> Minimum 84.78 141.31 113.05 141.31 56.52 169.57 706.54
#> Mean 84.78 141.31 113.05 141.31 56.52 169.57 706.54
#> Median 84.78 141.31 113.05 141.31 56.52 169.57 706.54
#> Maximum 84.78 141.31 113.05 141.31 56.52 169.57 706.54
#> sd 0.00 0.00 0.00 0.00 0.00 0.00 0.00
#>
#> % of region covered:
#>
#> North NW West Upper West Lower SW South Total
#> Minimum 0 0 0 0 0 0 0
#> Mean 0 0 0 0 0 0 0
#> Median 0 0 0 0 0 0 0
#> Maximum 0 0 0 0 0 0 0
#> sd 0 0 0 0 0 0 0
#>
#> Coverage Score Summary:
#>
#> North NW West Upper West Lower SW South Total
#> Minimum 0 0 0 0 0 0 0
#> Mean 0 0 0 0 0 0 0
#> Median 0 0 0 0 0 0 0
#> Maximum 0 0 0 0 0 0 0
#> sd 0 0 0 0 0 0 0