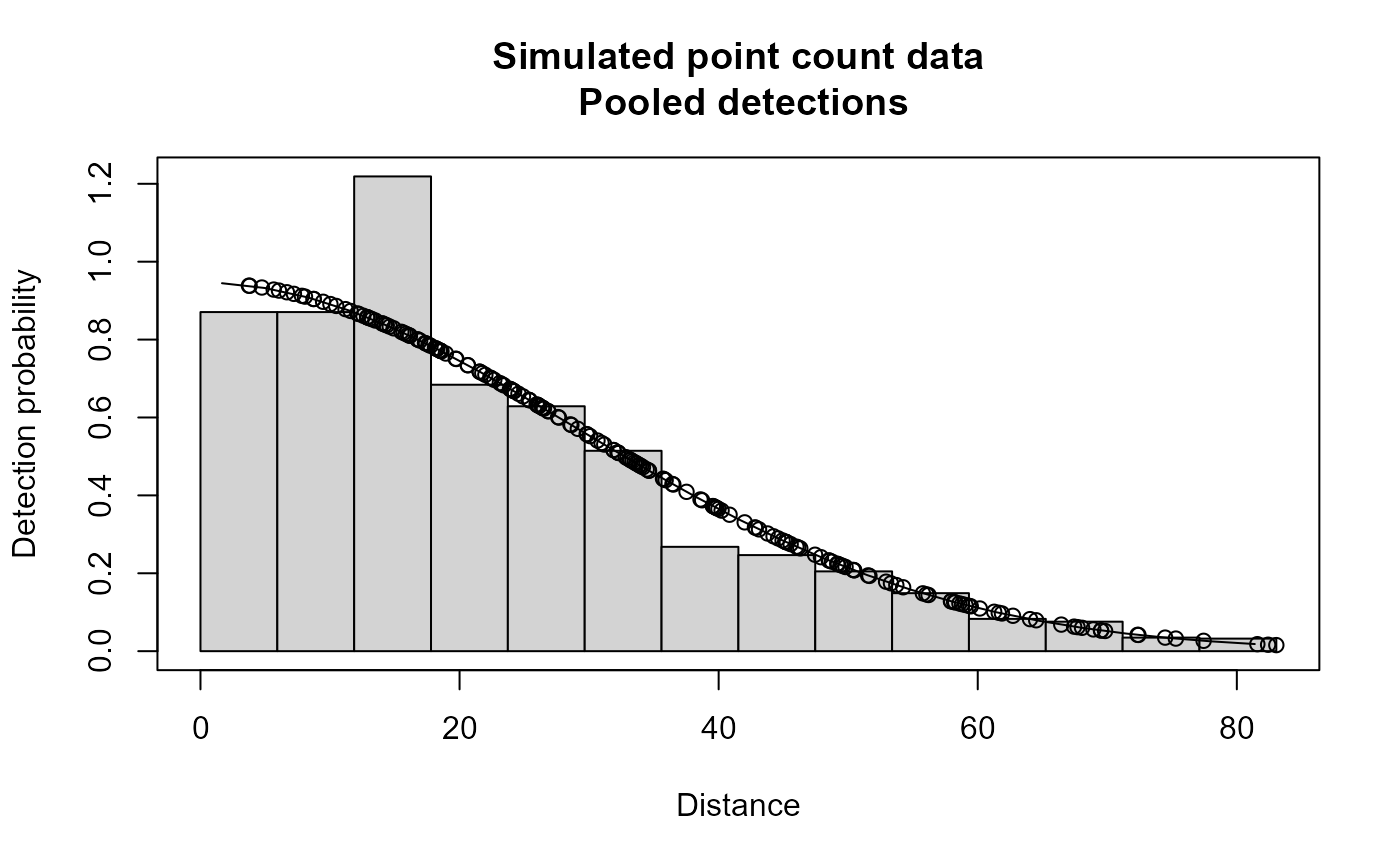
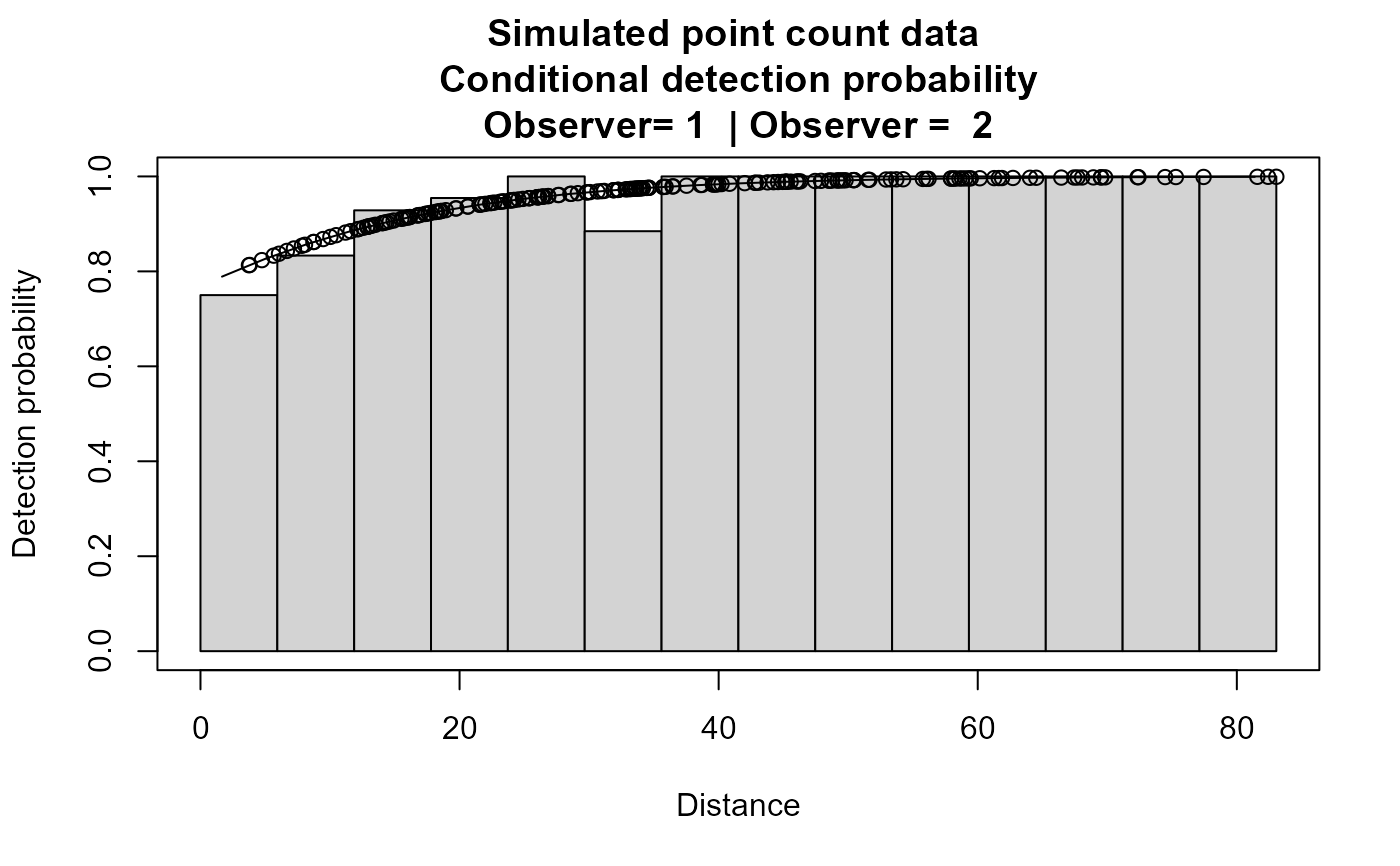
Simulated removal observer point count data with detection p(0)=0.8; hn sigma=30; w=100 for both observers with dependency y>0, gamma=0.1
Format
The format is 408 obs of 6 variables: distance: numeric distance from center observer: Factor w/ 2 levels "1","2": 1 2 1 2 1 2 1 2 1 2 ... detected: numeric 0/1 person: Factor with 2 levels A,B pair: Factor with 2 levels "AB" BA" object: sequential object number
Examples
# \donttest{
data(ptdata.removal)
xx <- ddf(mrmodel=~glm(formula=~distance),
          dsmodel = ~cds(key="hn", formula = ~1),
          data = ptdata.removal, method = "rem",
          meta.data = list(point=TRUE))
#> Warning: no truncation distance specified; using largest observed distance
summary(xx)
#>
#> Summary for rem.fi object
#> Number of observations               :  204
#> Number seen by primary               :  195
#> Number additional seen by secondary  :  9
#> AIC                                  :  69.33598
#>
#>
#> Conditional detection function parameters:
#>               estimate        se
#> (Intercept) 1.19813958 0.7821458
#> distance    0.07245812 0.0327875
#>
#>                       Estimate         SE         CV
#> Average primary p(0) 0.9462658 0.06457123 0.06823794
#>
#>
#>
#> Summary for ds object
#> Number of observations :  204
#> Distance range         :  0  -  83.04828
#> AIC                    :  1744.474
#> Optimisation           :  mrds (nlminb)
#>
#> Detection function:
#>  Half-normal key function
#>
#> Detection function parameters
#> Scale coefficient(s):
#>             estimate        se
#> (Intercept) 3.366348 0.0383046
#>
#>             Estimate         SE         CV
#> Average p  0.2394111 0.01708192 0.07134975
#> EDR       40.6352360 1.44965694 0.03567487
#>
#>
#> Summary for rem object
#>
#> Total AIC value =  1813.81
#>                        Estimate           SE         CV
#> Average p             0.2265465   0.02236647 0.09872793
#> N in covered region 900.4772670 104.77563511 0.11635567
plot(xx,main="Simulated point count data")


# }
# }